Featured projects


Project: Weather Py
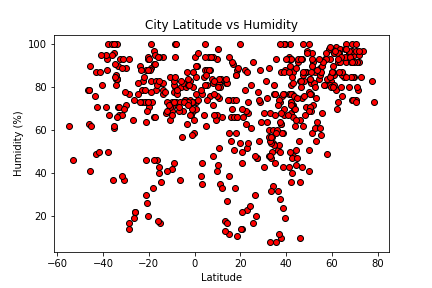
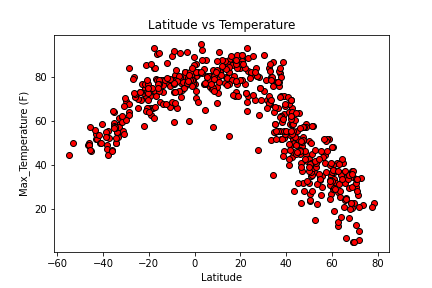
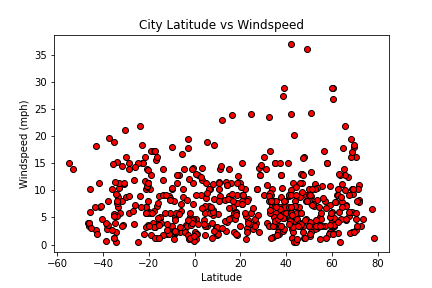
The Python code randomly selects a group of 500+ cities across the world. Then, the code collects data from the OpenWeatherMap API to create a representatitve model of weather across world cities. The API data is used to graph the following relationships: Temperature (F) vs. Latitude Humidity (%) vs. Latitude Cloudiness (%) vs. Latitude Wind Speed (mph) vs. Latitude
- The analysis includes the following:
- Randomly select at least 500 unique (non-repeat) cities based on latitude and longitude
- Perform a weather check on each of the cities using a series of successive API calls
- Include a print log of each city as it's being processed with the city number and city name.
- Save a CSV of all retrieved data and a PNG image for each scatter plot.
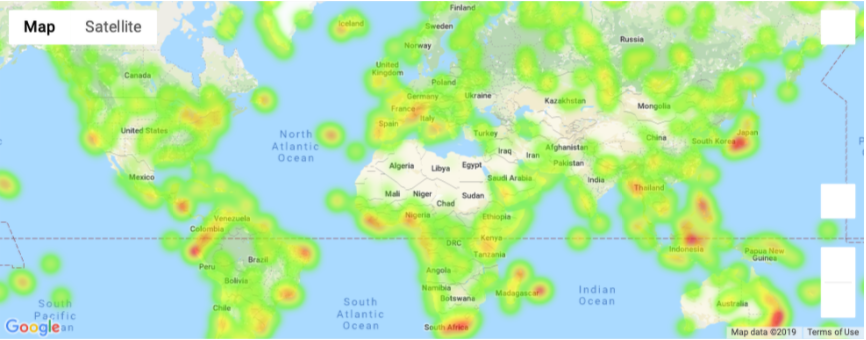
- Create a heat map that displays the humidity for every city
- Narrow down the DataFrame to find your ideal weather condition.
- Using Google Places API to find the first hotel for each city located within 5000 meters of your coordinates.
- Plot the hotels on top of the humidity heatmap with each pin containing the Hotel Name, City, and Country.
Features: Jupyter Notebook, Matplotlib, Pandas, Linear Regression, Python Requests, API's, JSON traversals
Screenshots:
(%) vs. Latitude Cloudiness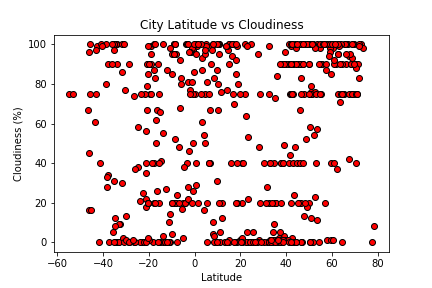
(%) vs. Latitude Humidity
(%) vs. Latitude Temperature
(%) vs. Latitude Windspeed
Heatmap